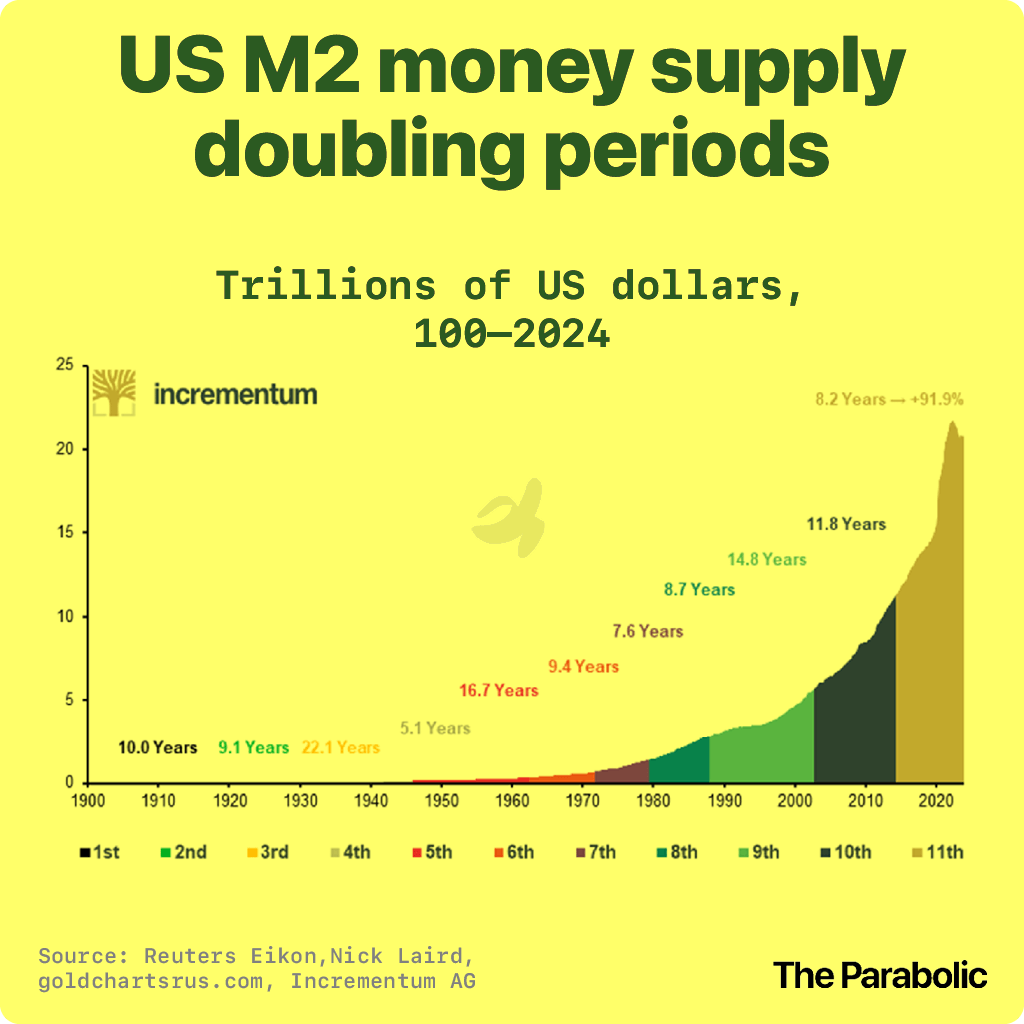
US M2 Doubling Periods, in trillions of US dollars
Why it matters
The parabolic rise of M2 money supply in recent years reflects extraordinary action by the Federal Reserve to support the economy.
And rapid M2 growth can signal potential economic issues. For example, a doubling of the money supply in a short timeframe can lead to too much money chasing too few goods, which can lead to inflation. This is because when more money is available, people tend to spend more, driving up demand and prices.
What's next?
The last doubling period of US M2 money supply was 8.2 years.
- Before that: 11.8 years
- Before that: 14.8
- Before that: 8.7
- Before that: 7.6
- Before that: 9.4
- Before that: 16.7
- Before that: 5.1
- Before that: 22.1
- Before that: 9.1
Ten doubling periods in more than a century gives an average of 11.4 years. Howerer, I am ready to bet that the next doubling will not take that long. Two reasons:
😲 The US government faces $210 trillion in unfunded liabilities.
💸 The world's autocrats are working — slowly — to dethrone the dollar via BRICS.
Whatevever happens, exponential growth in the money supply is bringing assets bubbles, debt crises, inflation and further loss of the dollar's purchasing power.
Source: Incrementum


