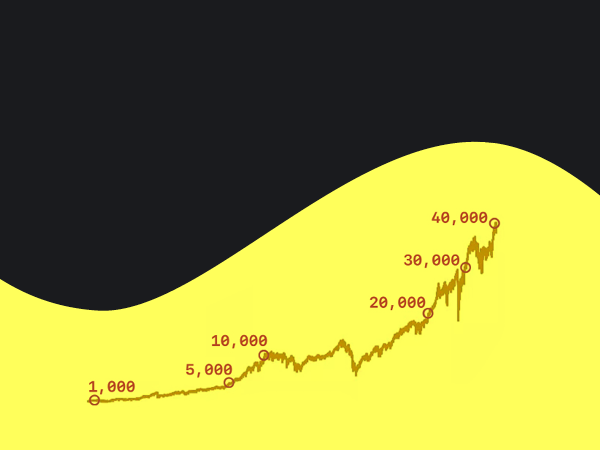
For years, Western economies — and financial charts — looked pretty simple; the line went up, or it went down.
Up was good. Down was bad — and everyone thought knew where they stood. There was also an idea that economic pain and gain were shared about equally throughout society.
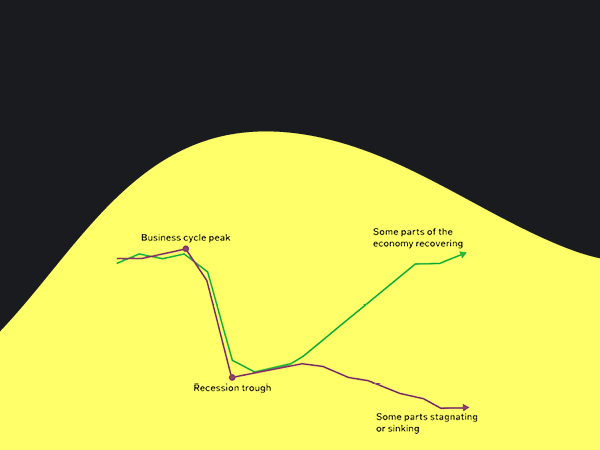
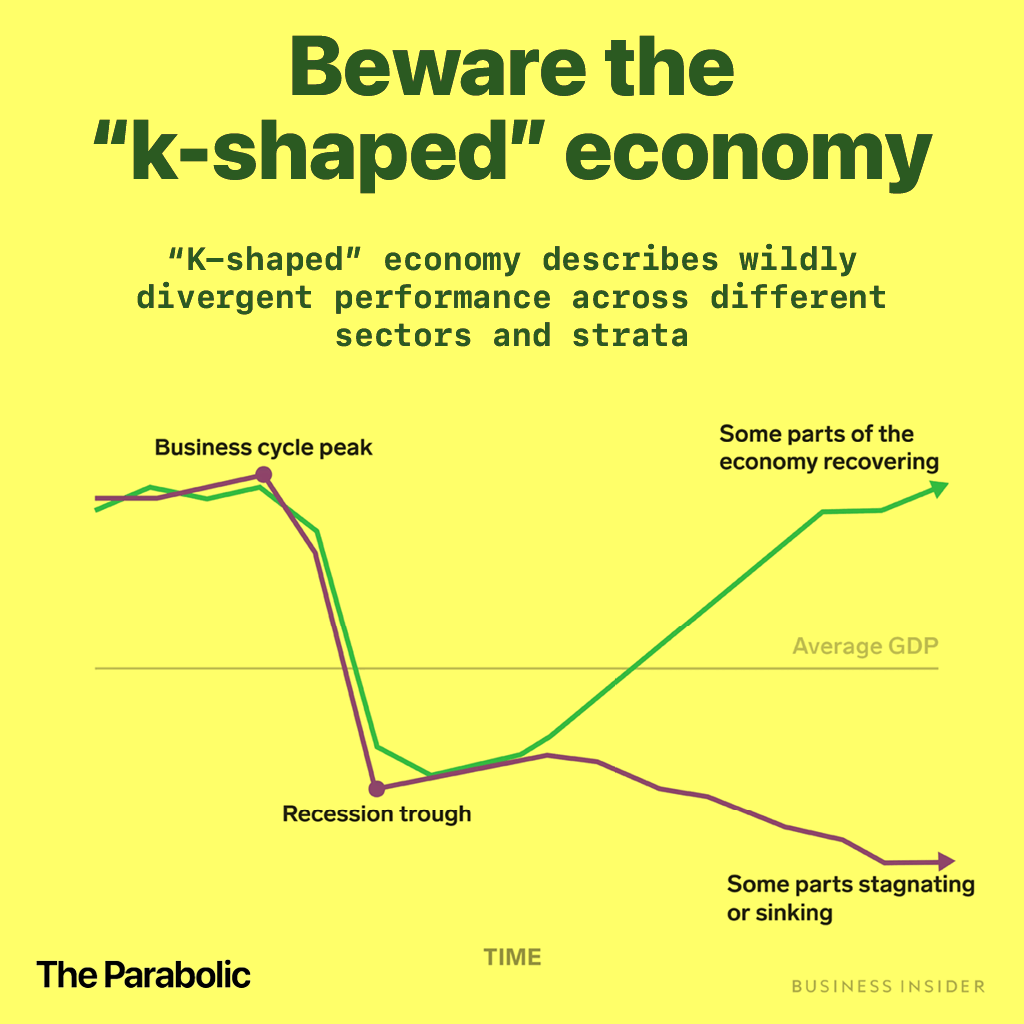
Covid-19 ended that fantasy — and brought the idea of the "K-shaped" economy to the mainstream.
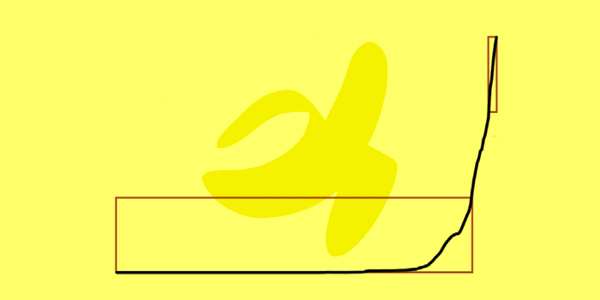
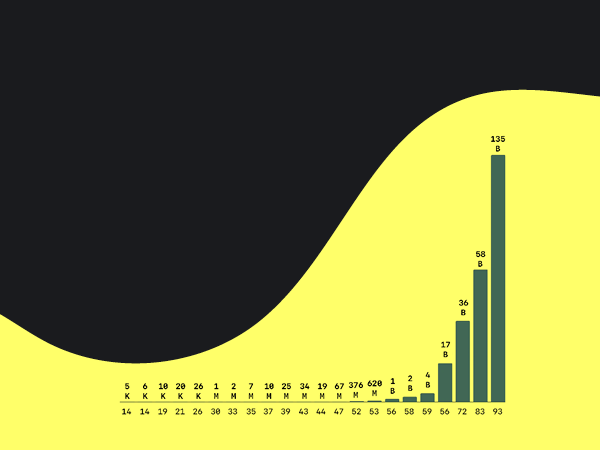
Today's chart shows that the divide between haves and have-nots is wider than ever.
Why it matters
One promise of liberal democracies is that anyone who works hard and has a bit of luck can climb the greasy pole to financial security.
That promise looks empty these days, especially after covid. The fight against Covid, brought wildly uneven gains in post-lockdown economies, making the rich, much richer.
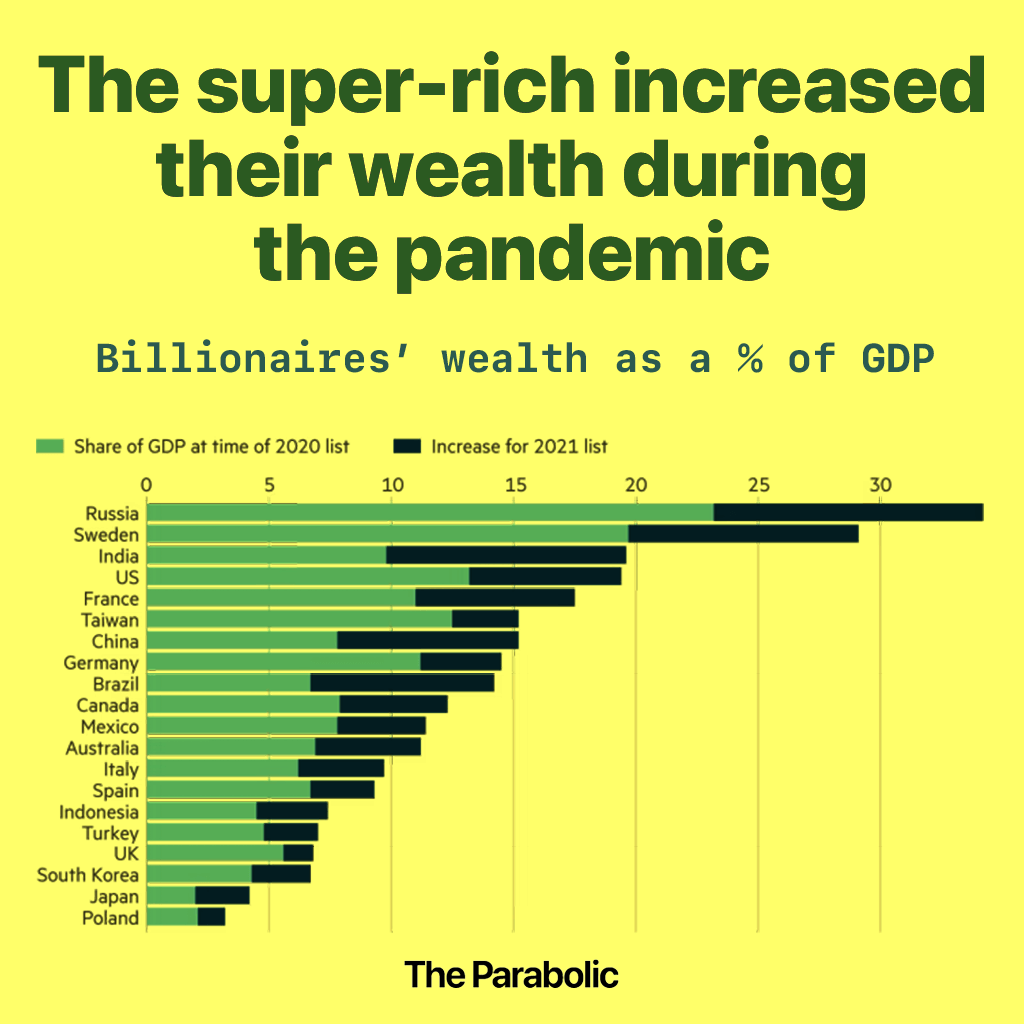
More than $10 trillion was spent fighting Covid-19. Where did it go?
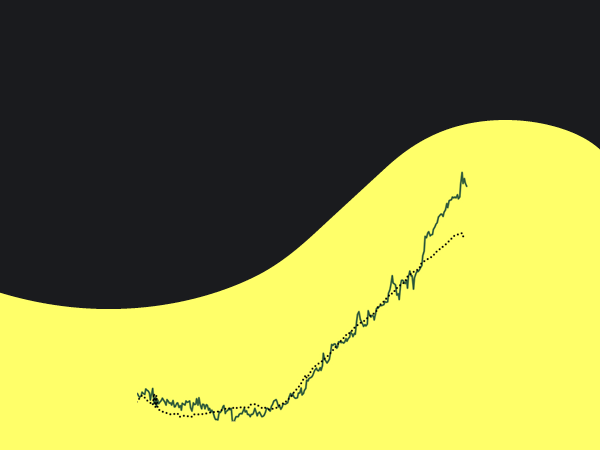
The world's billionaires got around $4 trillion richer during the same period.
Yes. Almsot 40% of the money created to fight Covid ended up in the pockets of a handful of billionaires.
And Covid-19 was but a speedbump on the way to the main event👇
